Tracking Global Warming, Scalar & Vector Perspectives
As the rapidly shifting patterns of Water and Wind that we know as Weather tell us, we are in the process of a major shift in Climate. Uncertainty about extreme weather is the new normal. Let us all work together, to get global warming under control, preferably sooner than later.
Wars speed up global warming.
Extreme weather is but one manifestation of the current Age of Extinction, known as the Anthropocene. Widespread loss of species, currently est. at 30-50%, is another marker of this period.
The Anthropocene is expected to leave its mark on the Earth that can be tracked by our descendants for centuries, if not millennia.
We thought we were engaged in rapid technological and societal development during the last century. Now we know that those efforts led to increased greenhouse gases (e.g., CH4, CO2, N2O, halocarbons), which have resulted in the warming of the atmosphere and the hydrosphere, as seen in both the accelerating warming of our oceans and the rapid melting of circumpolar glaciers.
The circumpolar cold water taps are slowing.
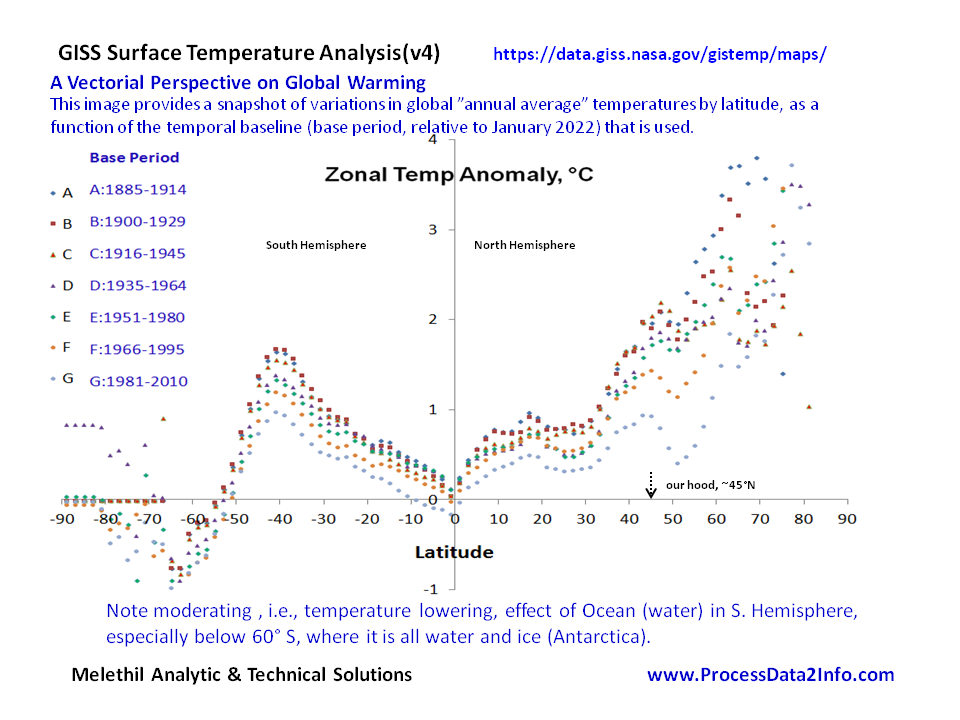
How do we track the global warming?
Reports in the media, and even those from national agencies use a scalar, a number, representing an averaged annual global temperature. Warming over both land and ocean, generates that average, with all of the attendant scientifically questionable assumptions in the model, including the rapidly changing thermohaline structure of our polar oceans.
This process implicitly averages out regional temperature variations, blocking widespread public awareness of regional (e.g., microclimate) variations.
As the data (slides, 2022) show us, the mid latitudes in the North have warmed to ~ 2 C above preindustrial (scalar) standards. We are beginning to see the impacts of increased radiative forcing as higher variability in wind (fire) and water (precipitation) related weather events, which are also becoming more intense.
Both 2023 and 2024 are tracking to be among the warmest years in the 21st century.
Vectorial perspectives (slides) show latitudinal variations in global warming more clearly.

A quantitative treatment of temperature shifts, as discussed.